See where the money goes, and what you're worth.
A live income-to-spending breakdown, a growing net worth trend, and (once you connect a servicer) your real mortgage balance.
- report views: Overview, Monthly, Annual
- 3
- months of detail in one annual view
- 12
- biggest categories broken out, the rest rolled up
- 5
- ways to value a connected mortgage
- 2
Income and spending, broken down
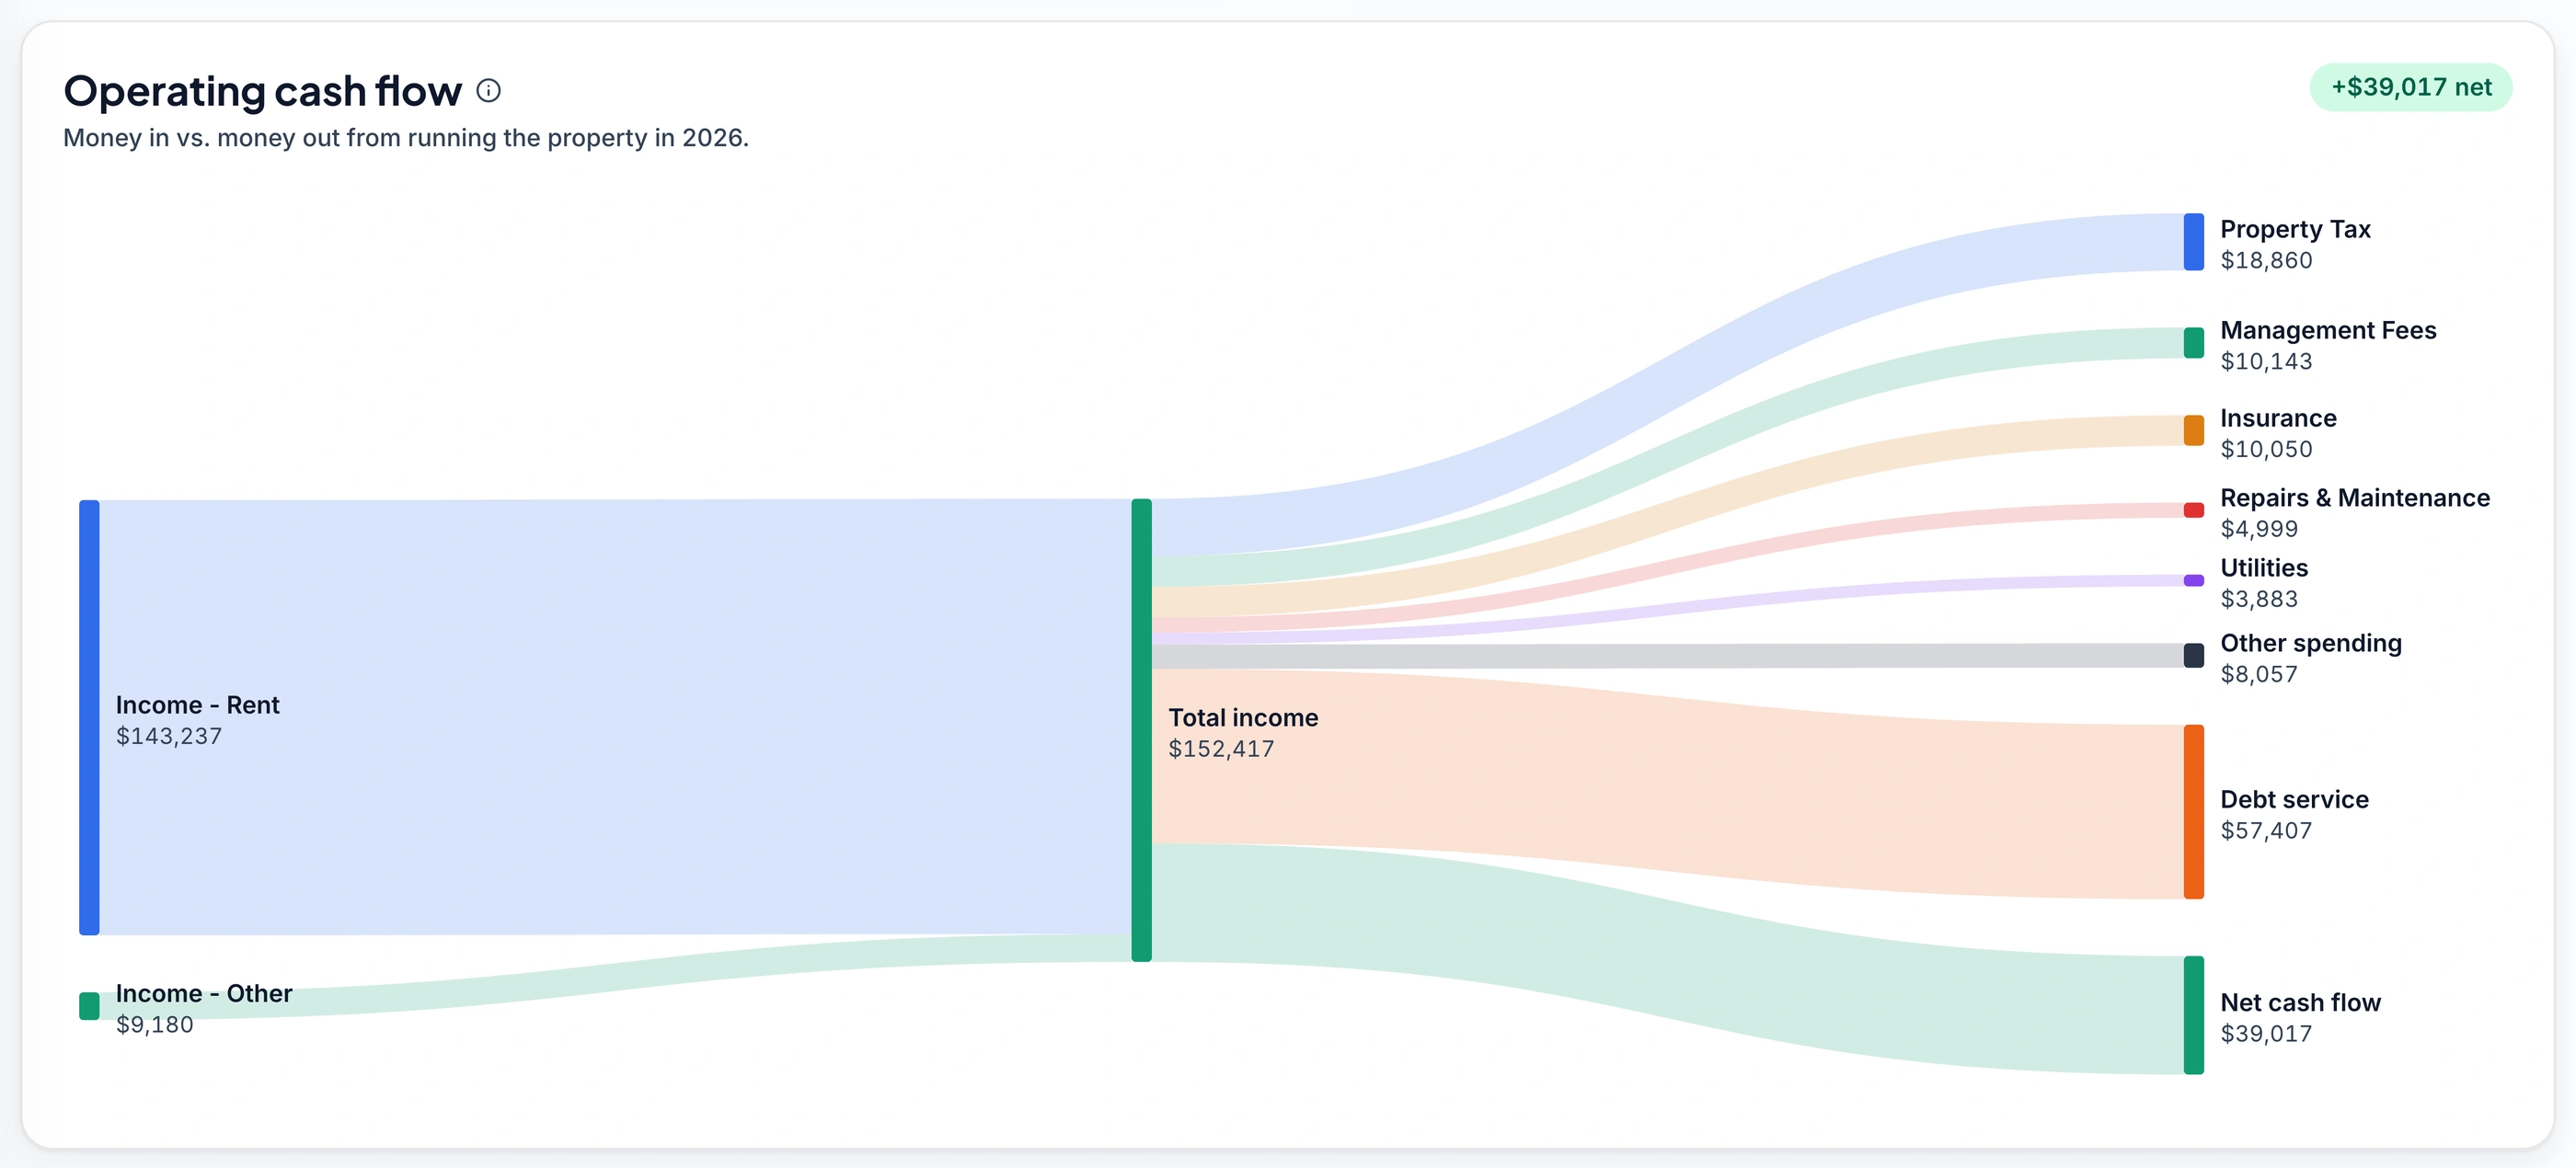
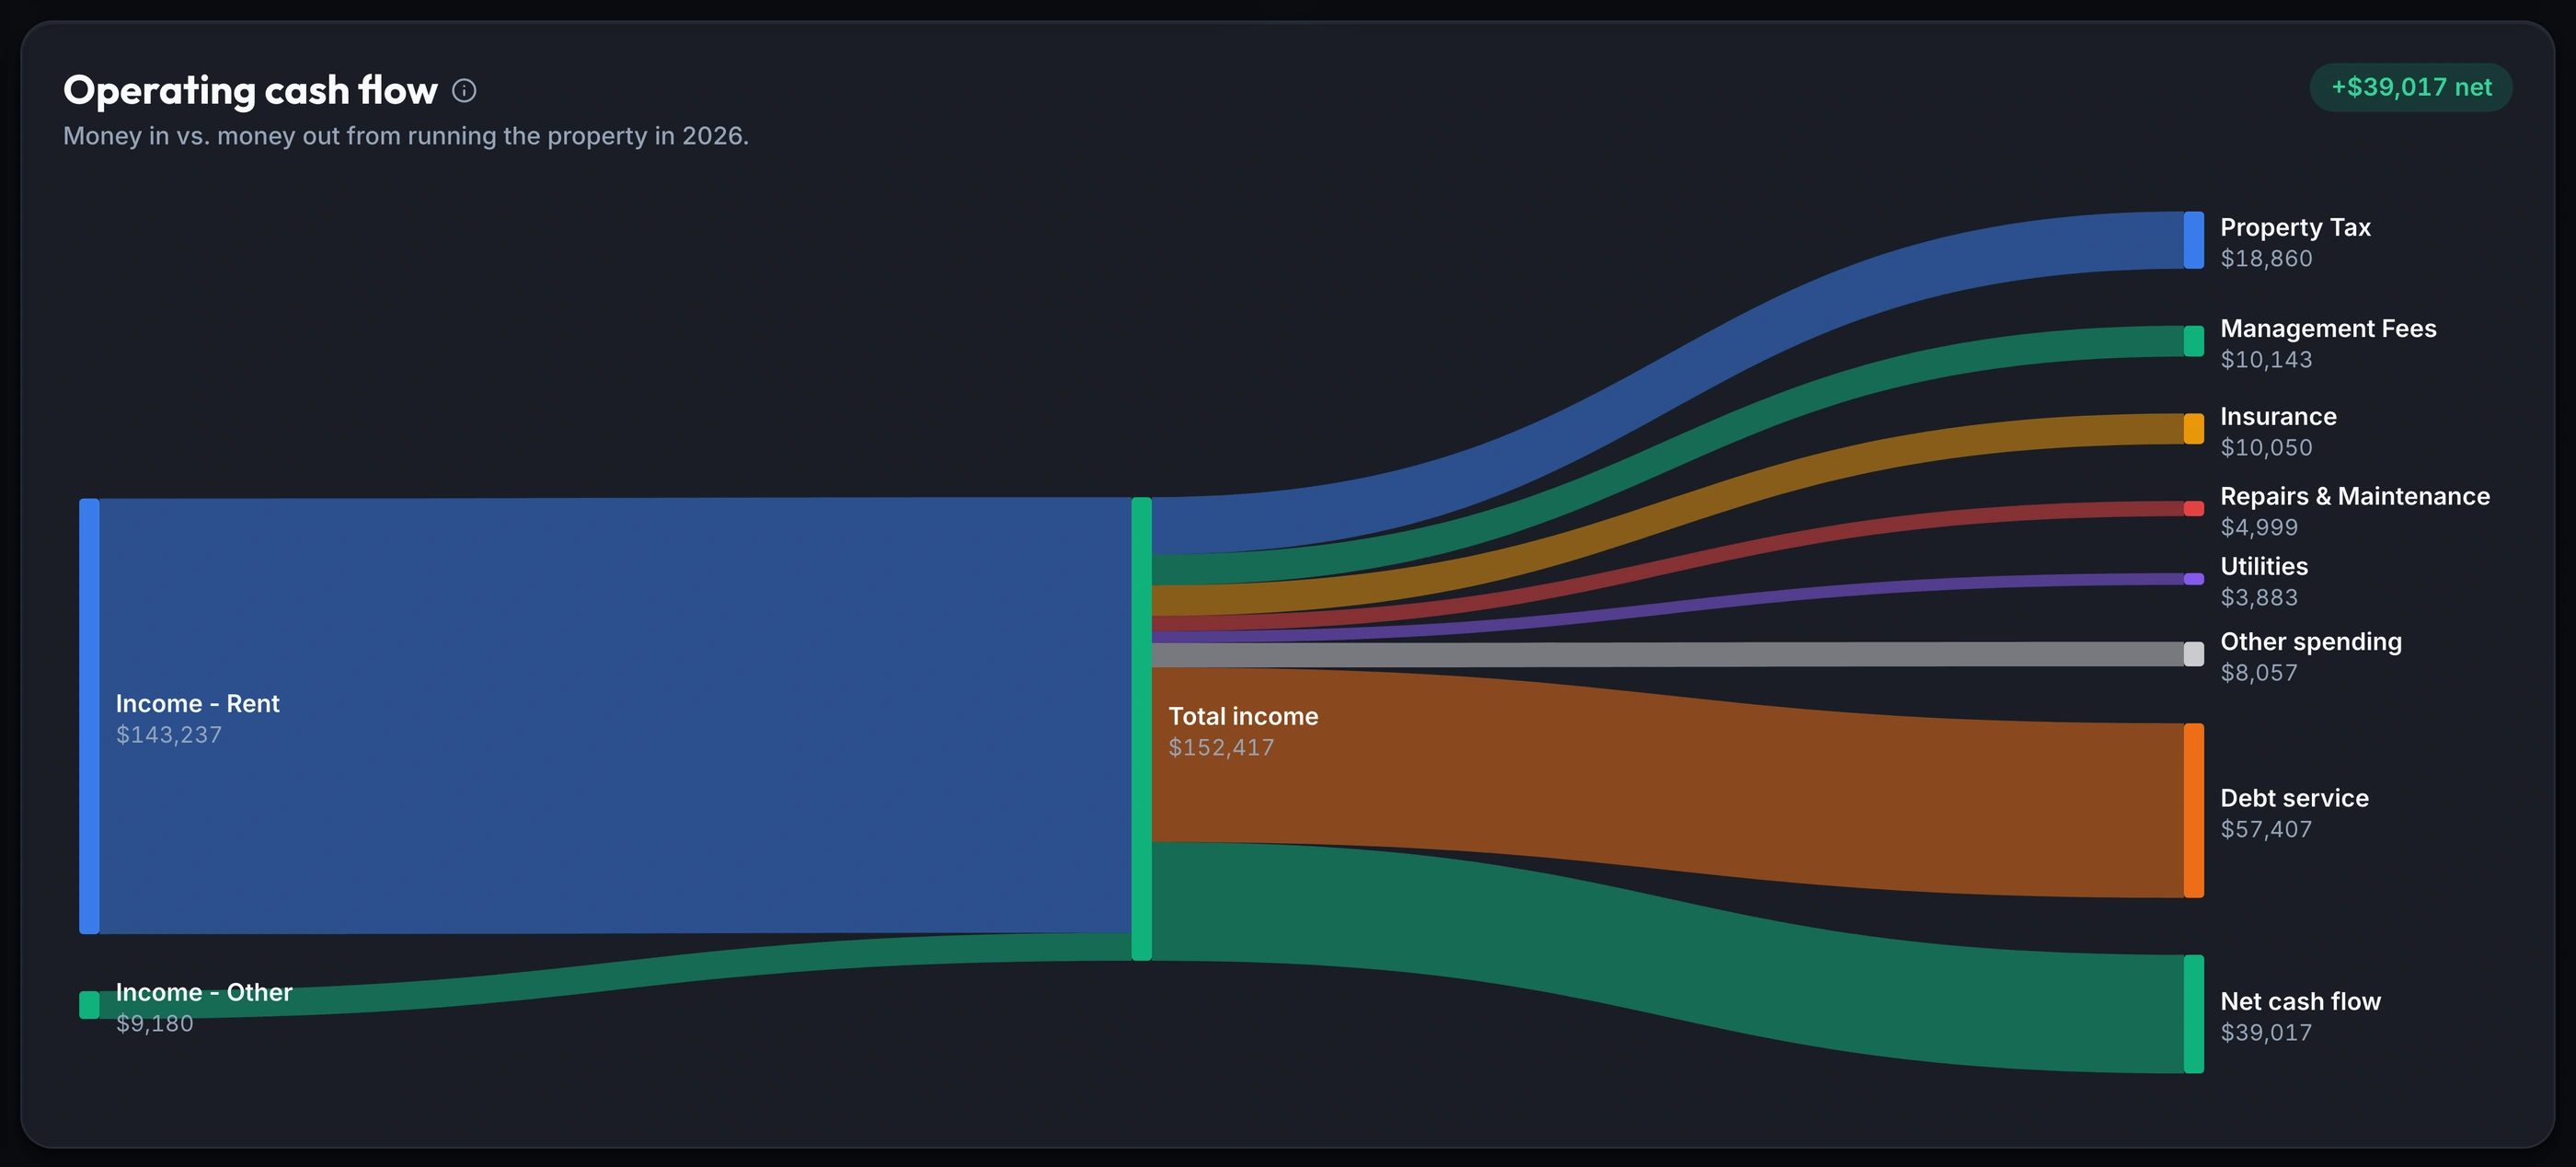
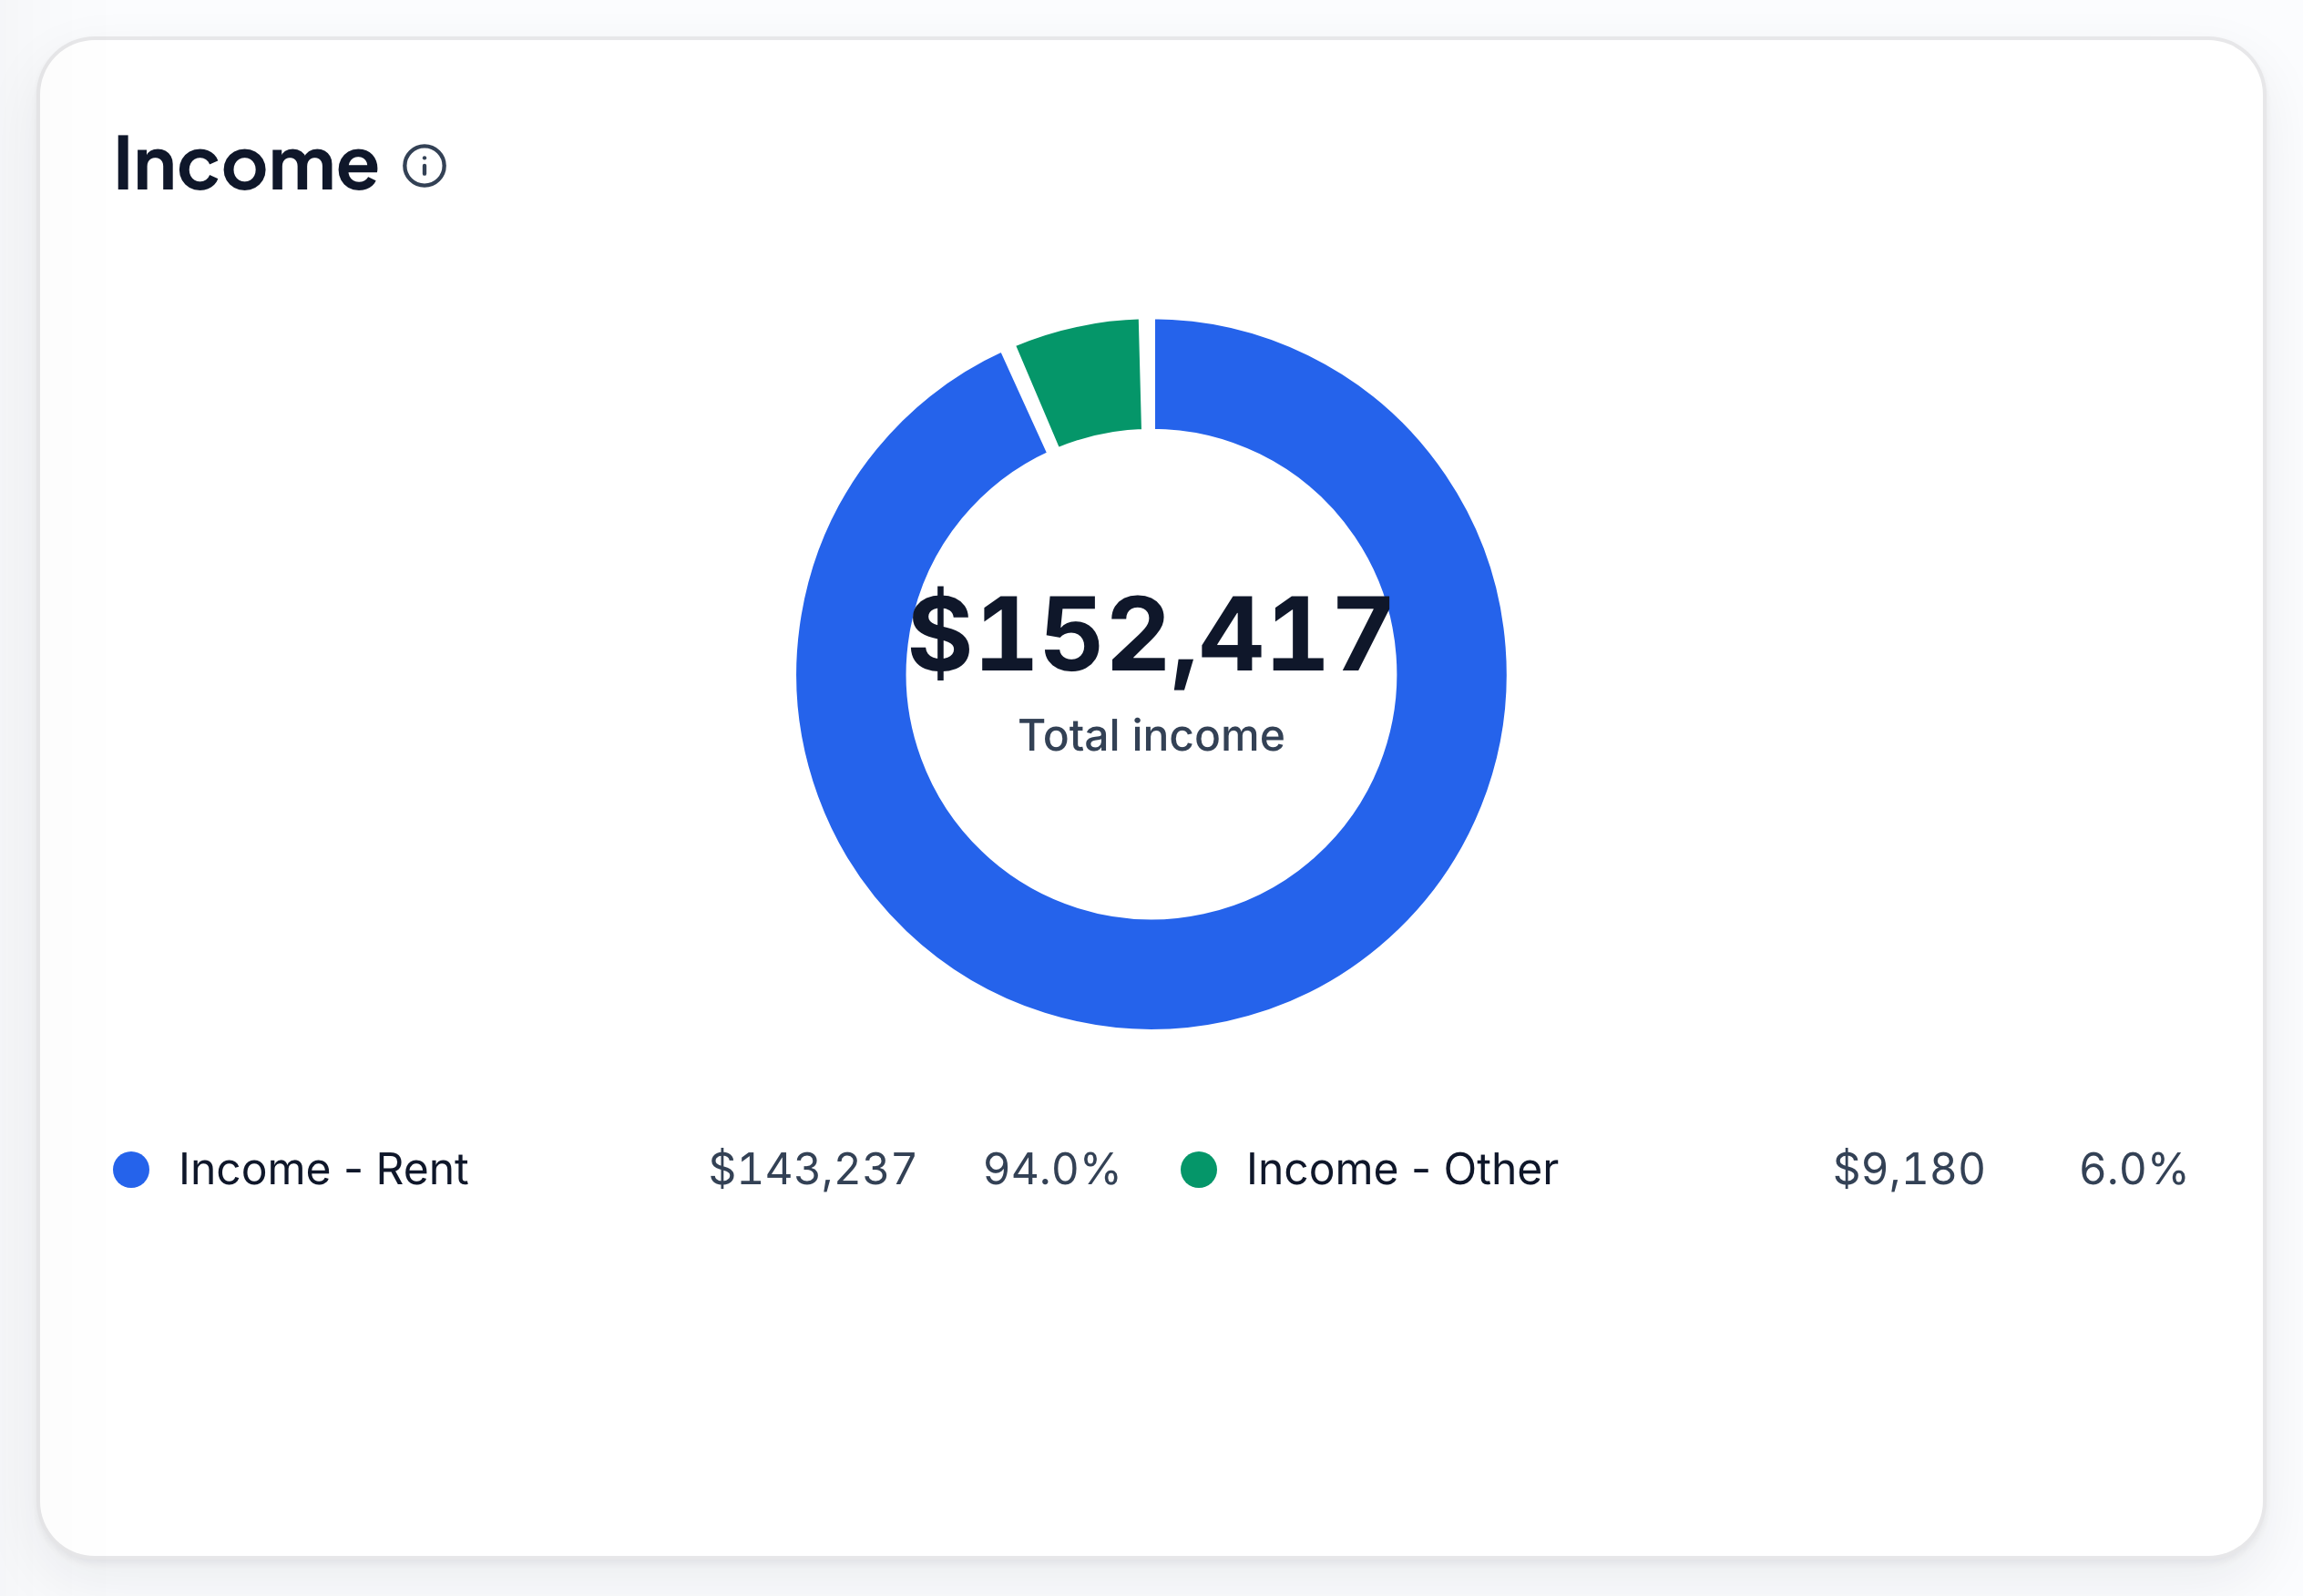
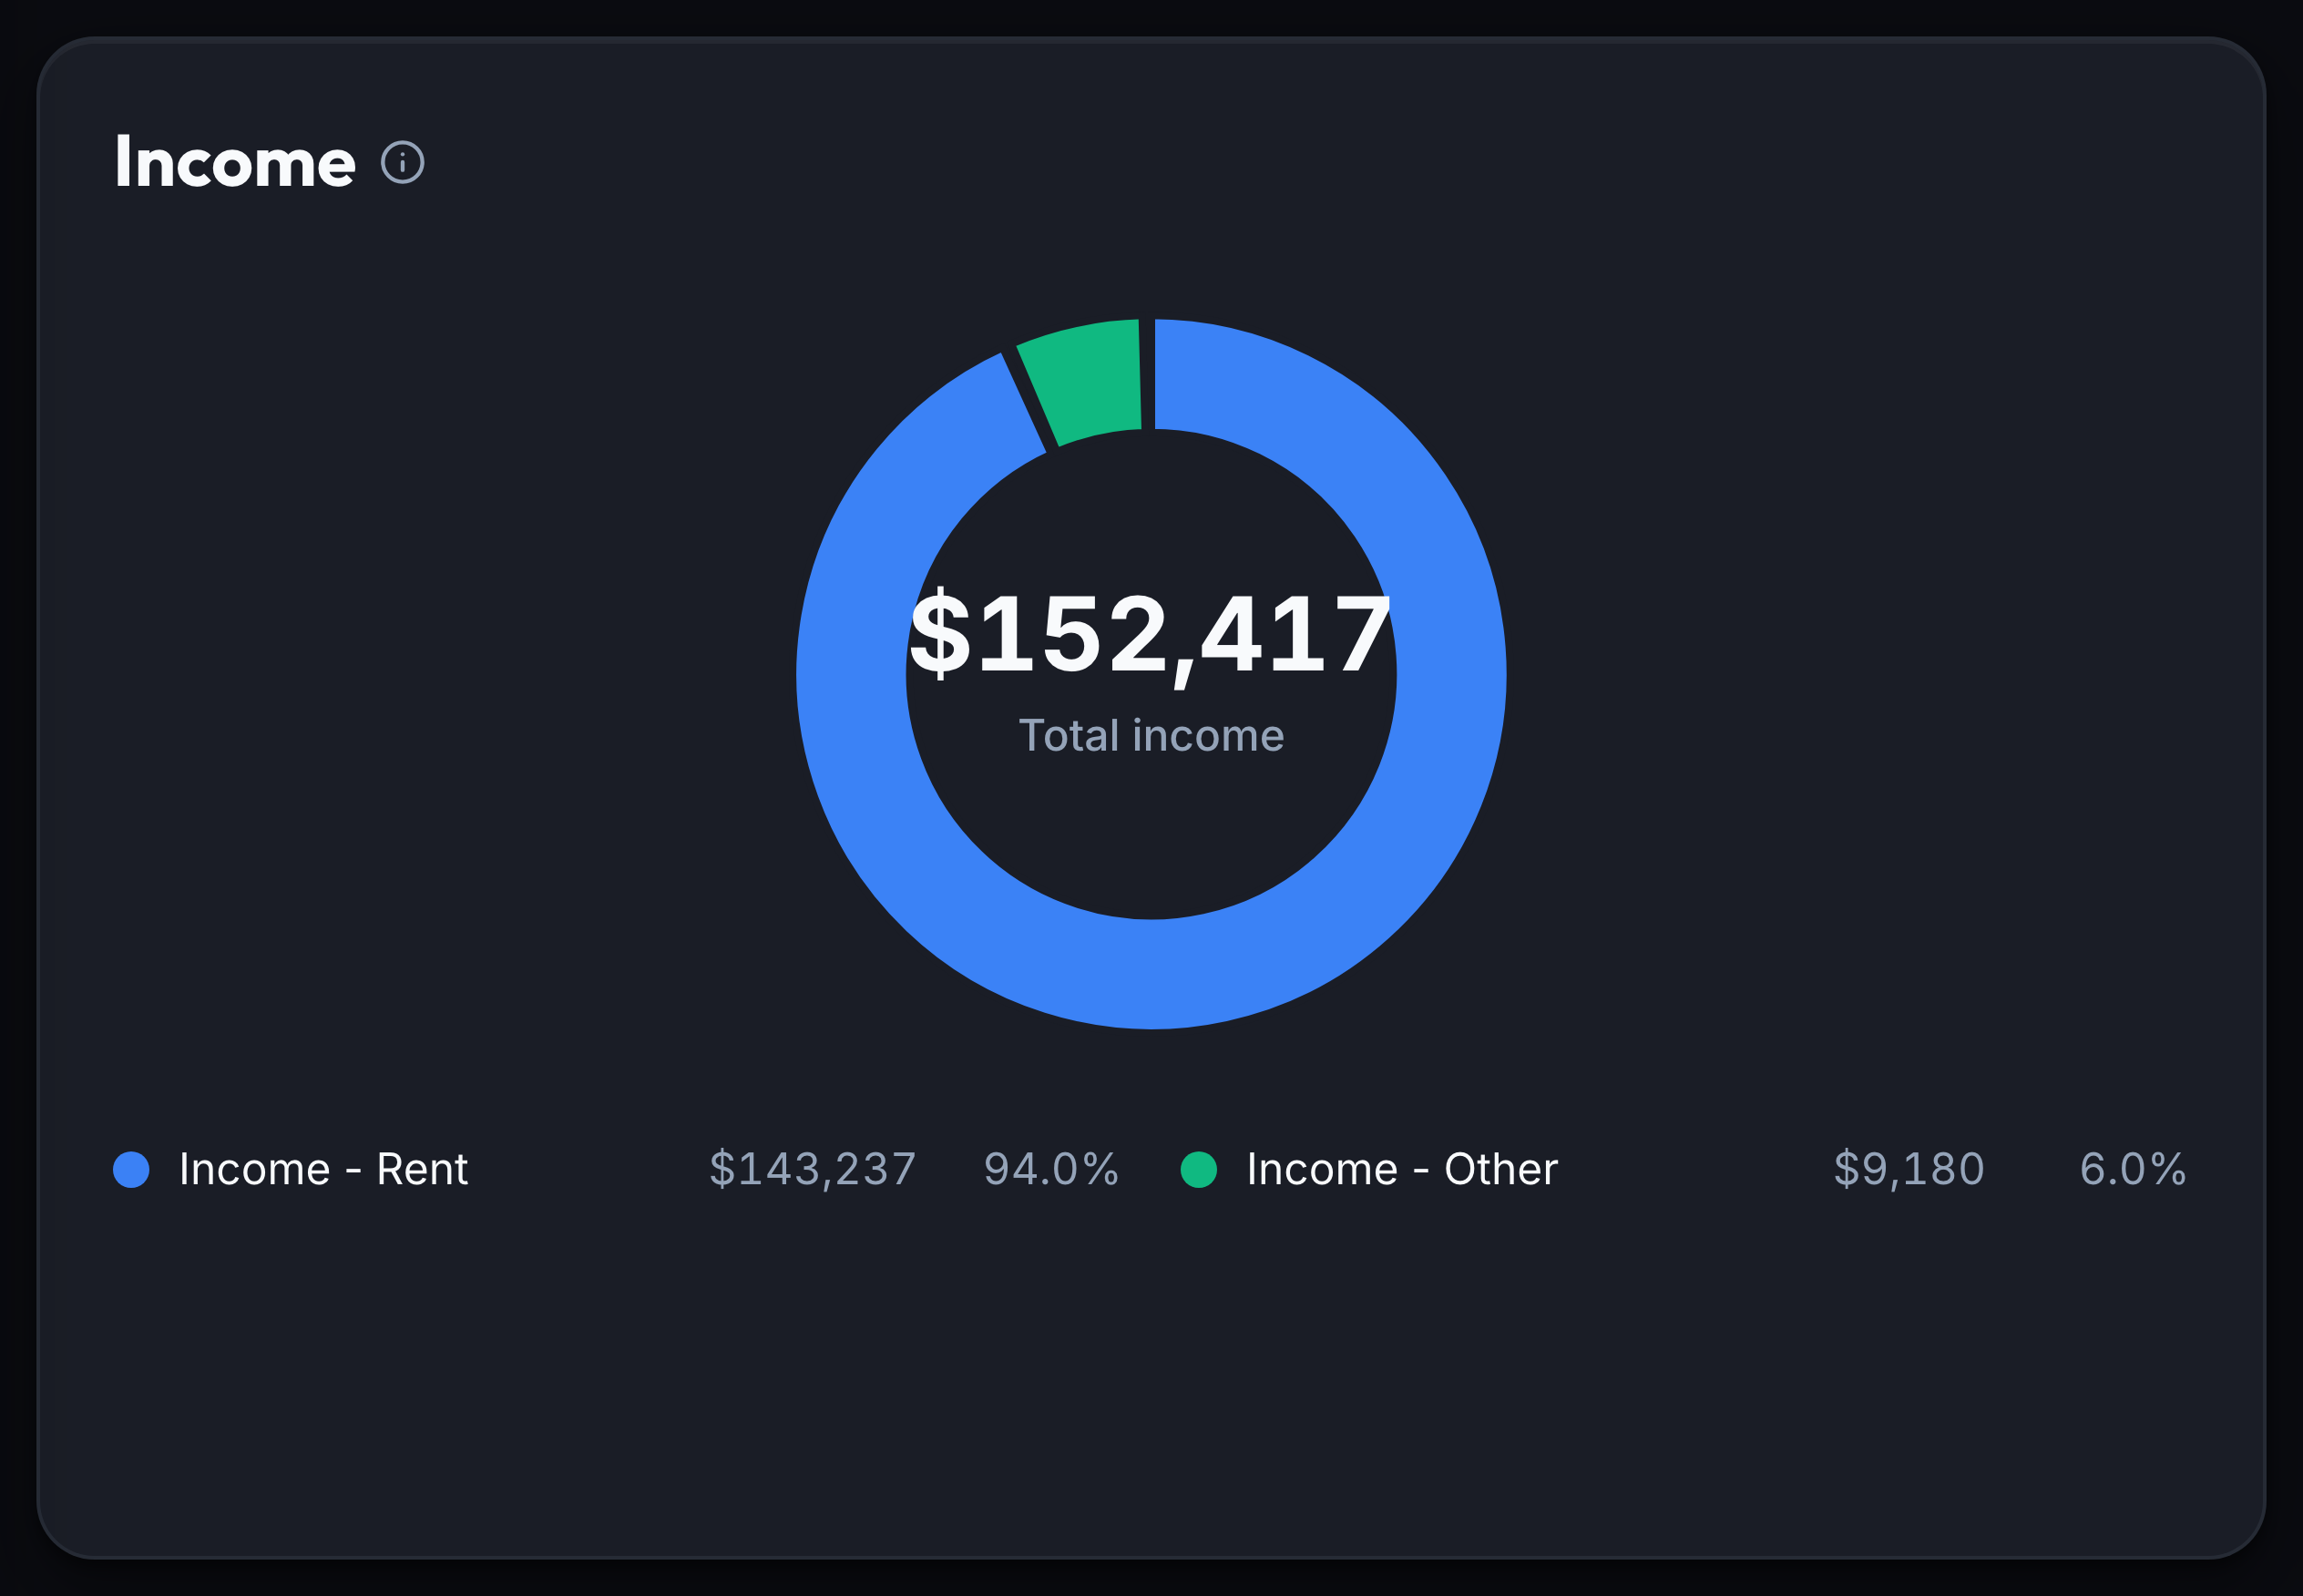
The Overview tab turns every property's income and spending into two clean breakdowns, plus one cash-flow diagram tying them together.
- Rent and other income totaled and broken out
- Every expense category shown with its own dollar total
- Debt service split out, never mixed into spending
- Filter by property, or view the whole portfolio
Where the spending really goes
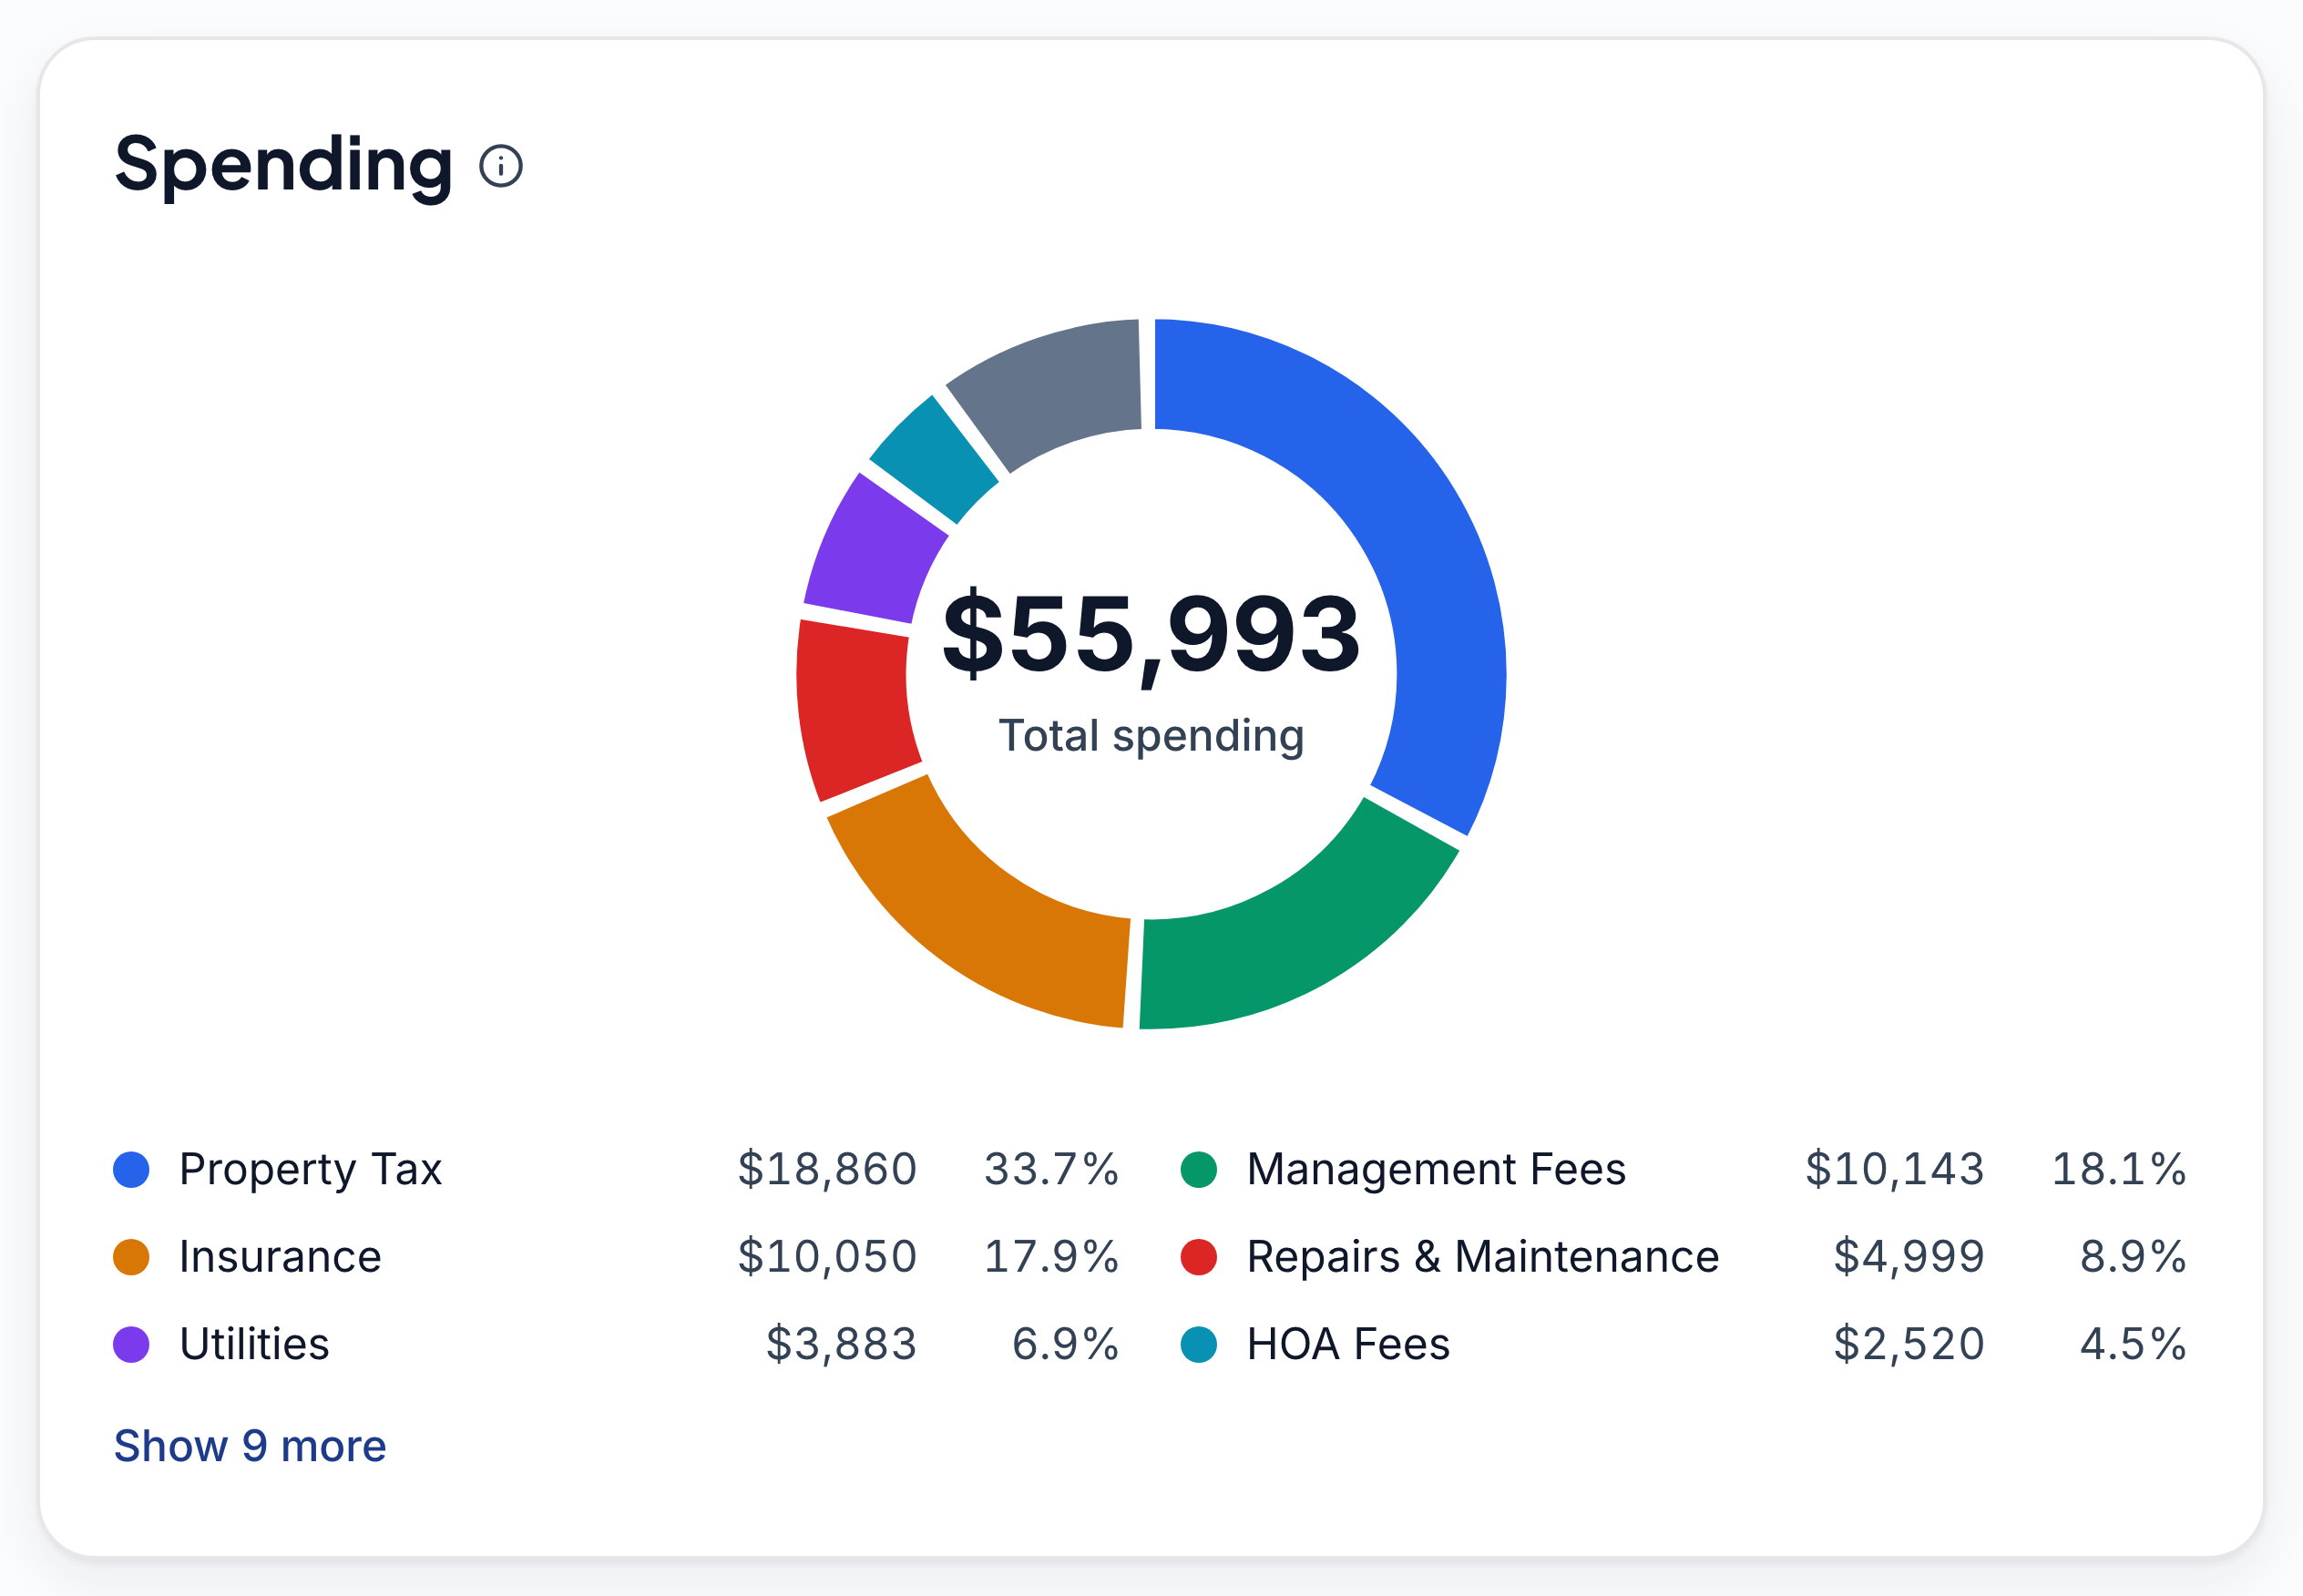
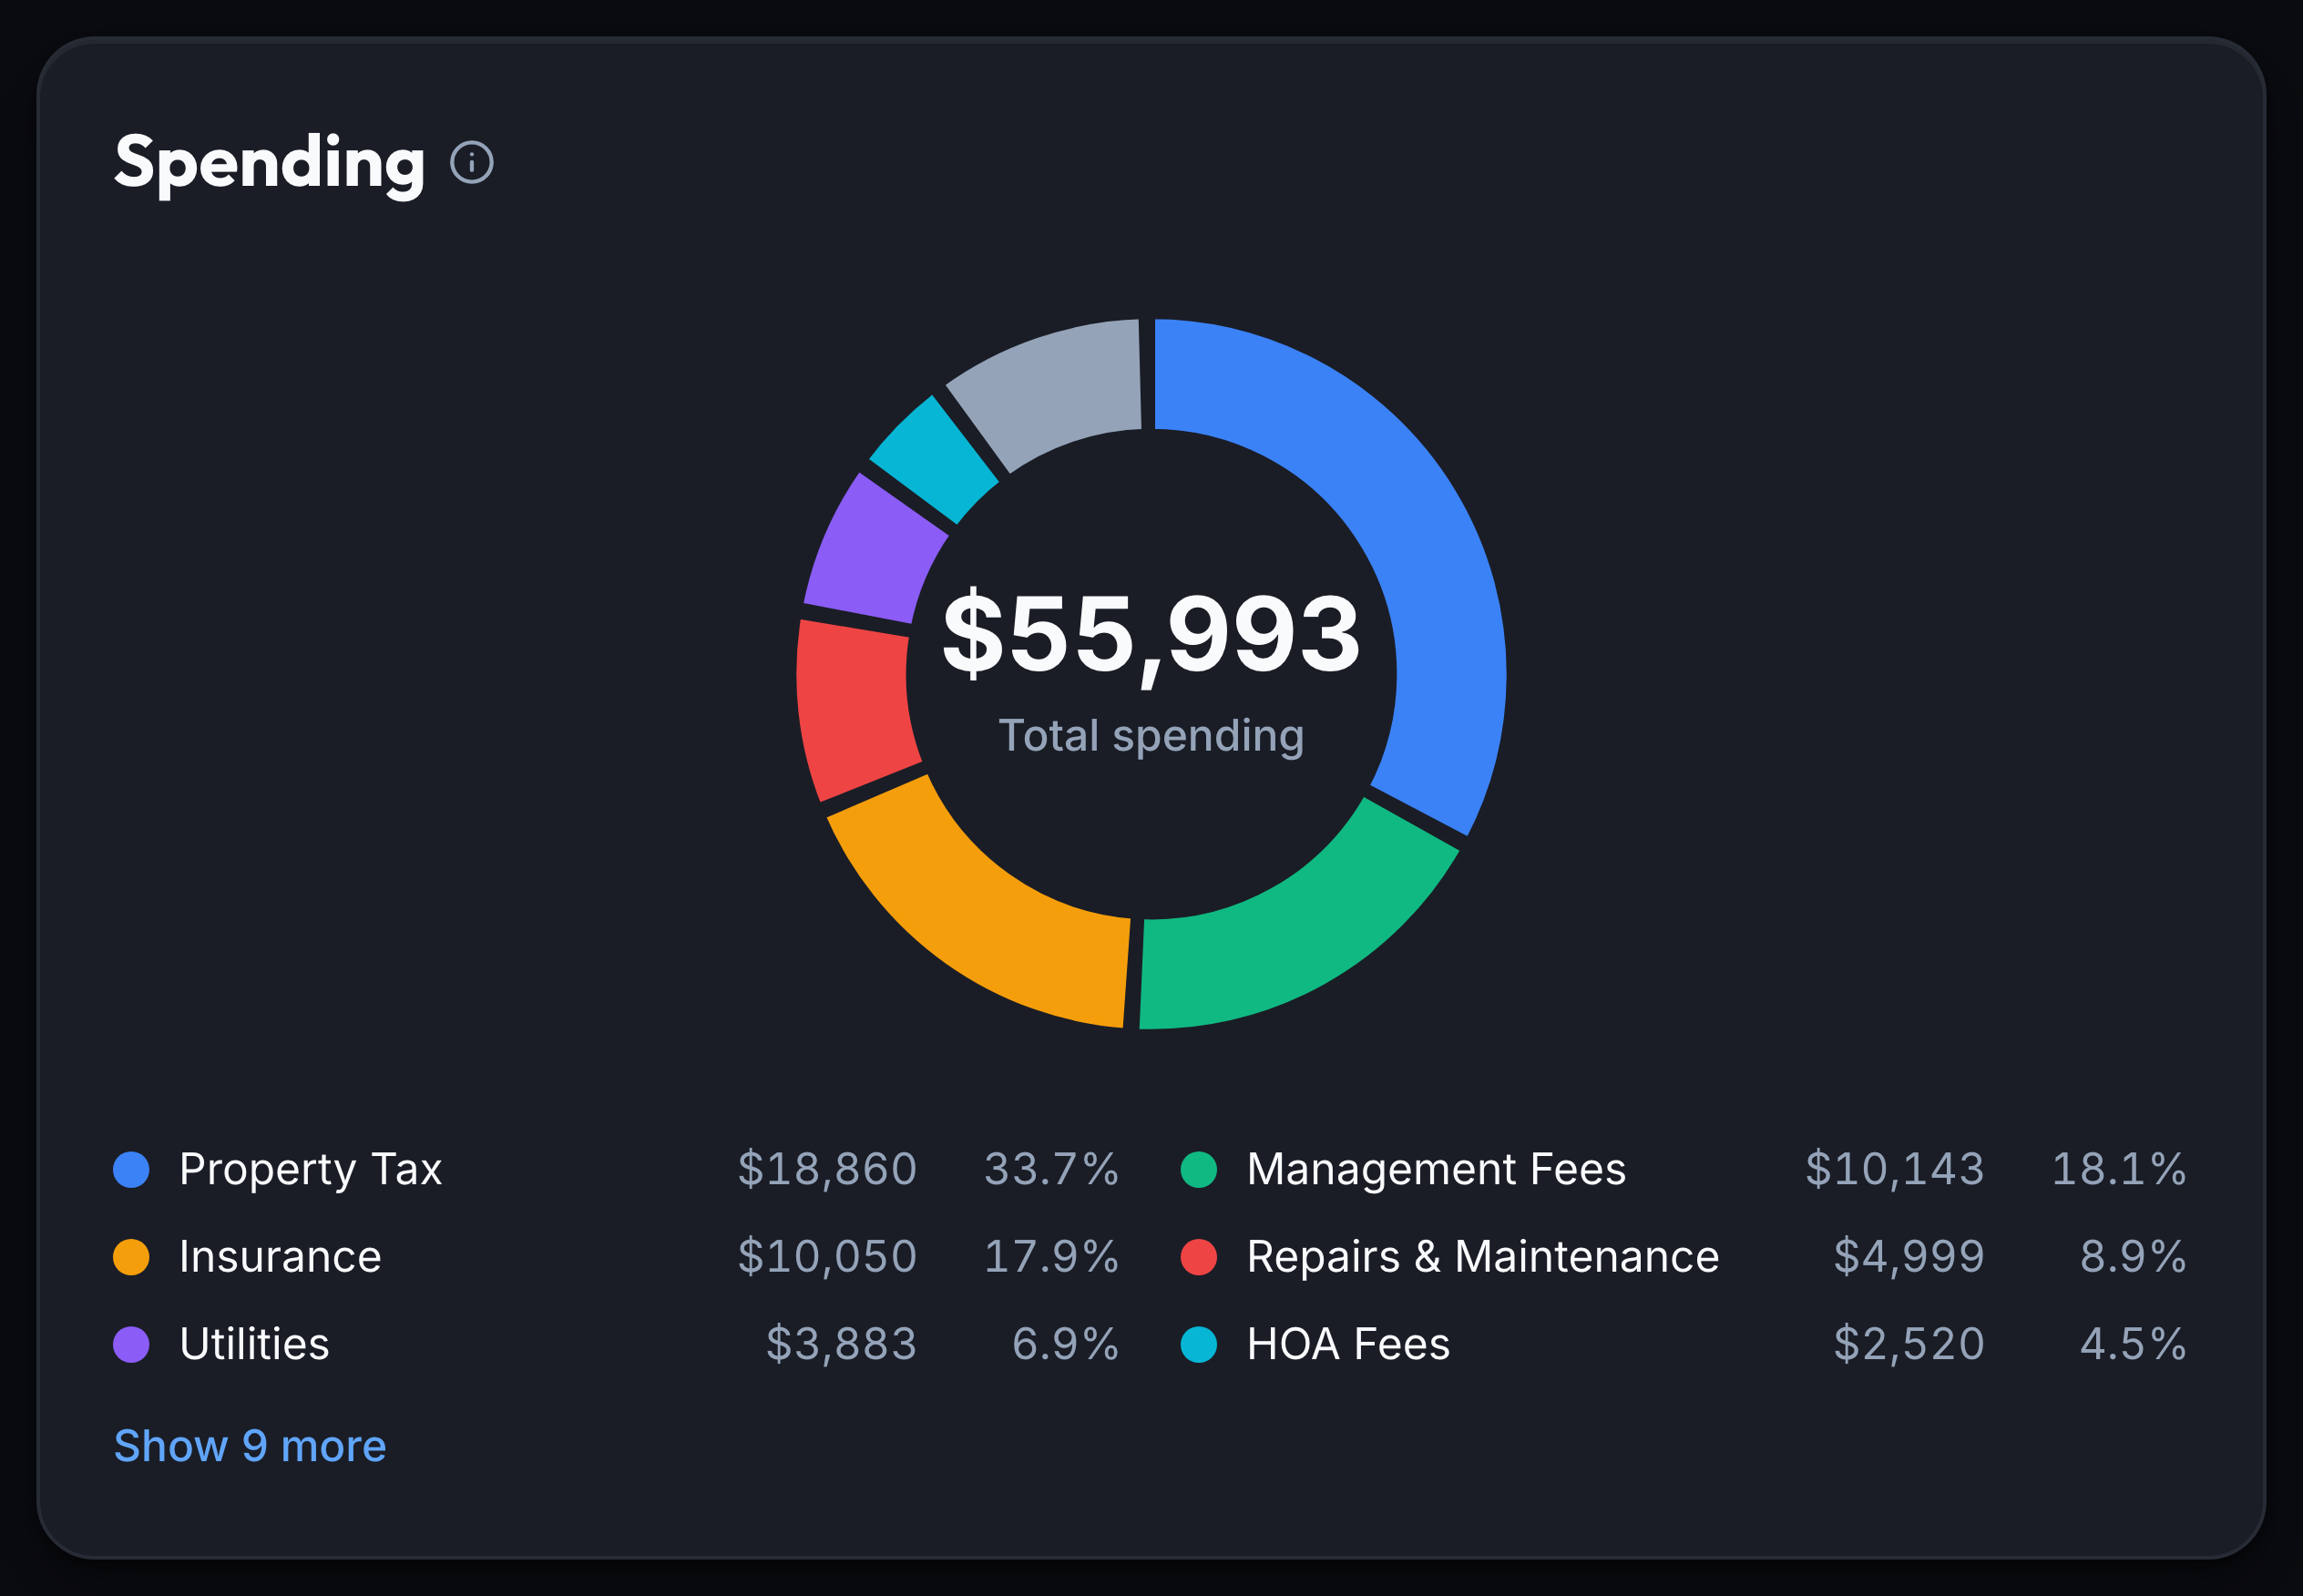
The same categories power a spending donut, so the property tax and insurance lines that dominate the year are easy to spot.
- Every category ranked by dollar amount and share
- Property tax and insurance usually carry the biggest slices
- The same colors and categories as the ledger itself
Net worth, tracked without spreadsheets
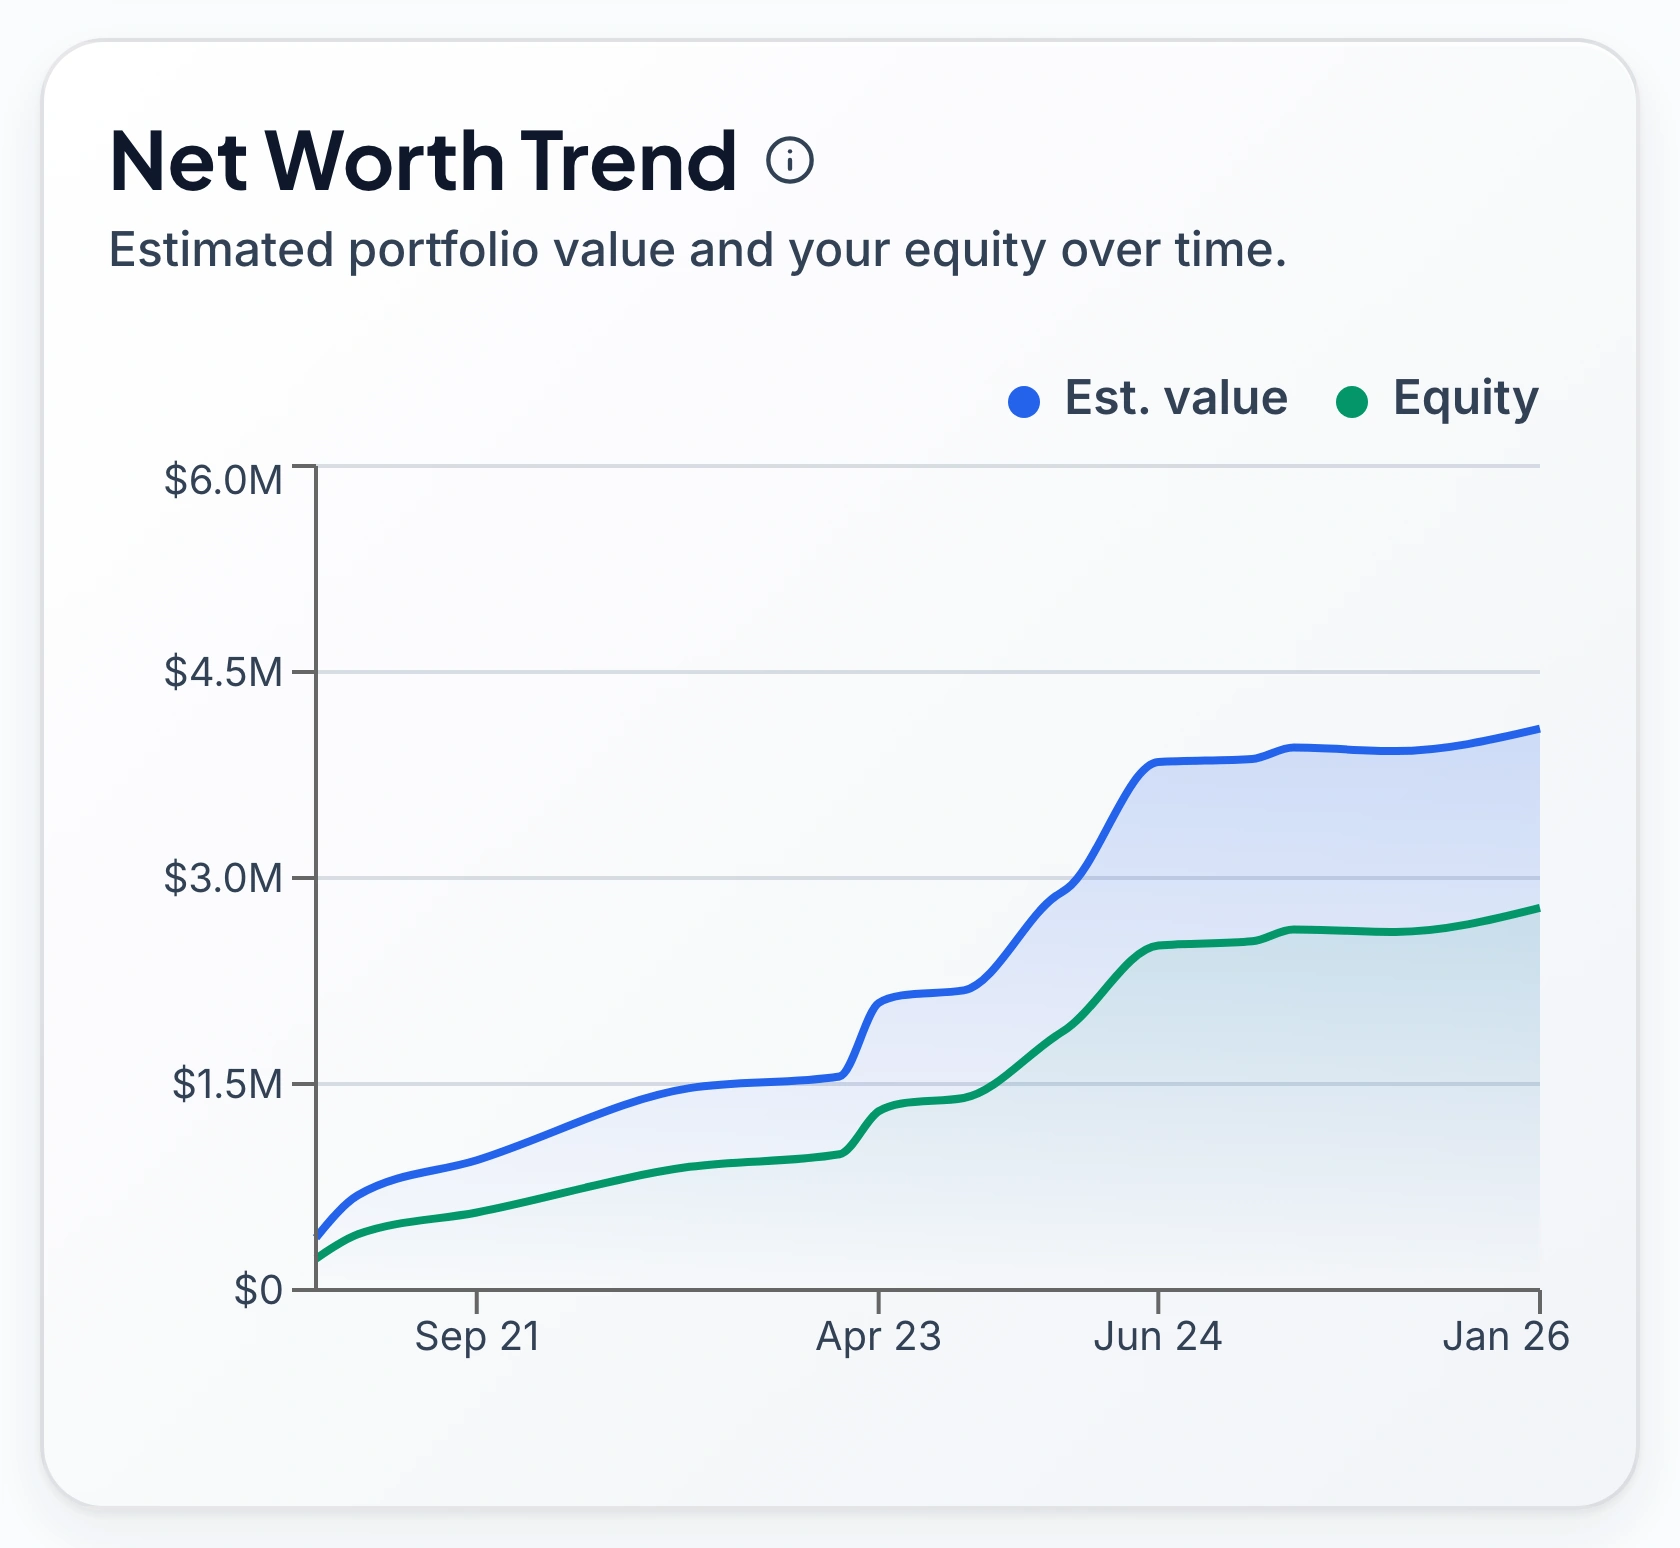
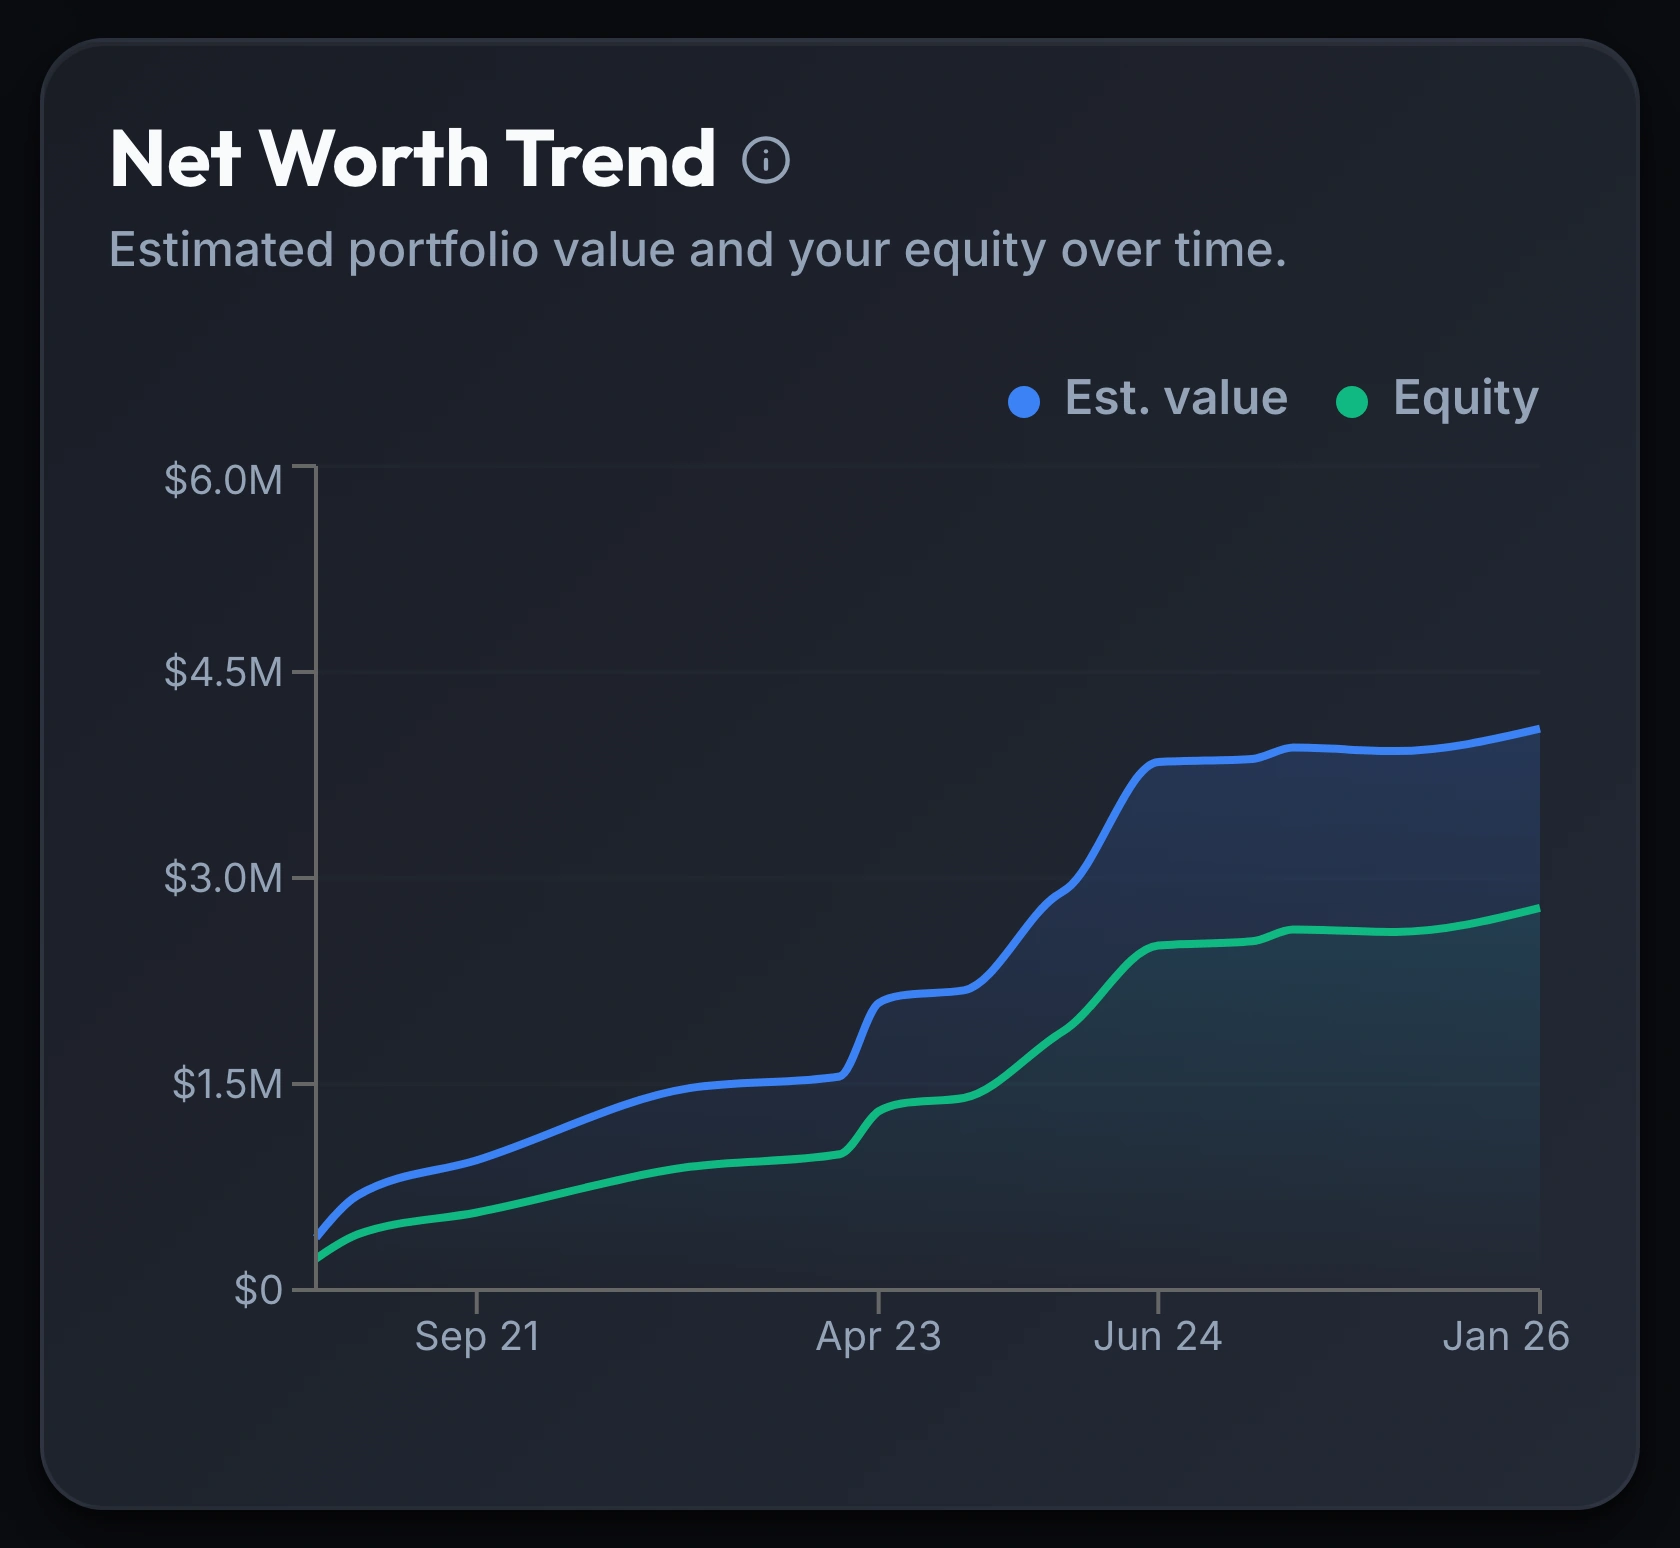
The Net Worth Trend chart pairs your portfolio's estimated value against your equity, recomputed from your recorded property values and loan terms every time you look.
- Estimated value and equity plotted side by side
- Equity falls out of the mortgage math automatically
- Mortgage balance computed from your loan terms by default
- Property values update whenever you record a new one
The real number, from your lender
Connect your mortgage servicer once (Pro), and equity switches from a computed amortization schedule to the balance your lender actually reports.
- Switch between computed and live balance any time
- Connecting a servicer never locks you into using it
- Reads only: Keystone IQ can never move money
What you get
Operating cash-flow diagram
income vs. spending, one view
Income & spending breakdown
by category, every month
Net Worth Trend
estimated value and equity over time
Monthly & Annual views
every month, side by side
Live mortgage balancesPro
straight from your servicer
CPA tax-package exportPro
PDF and Excel, one click
AI year-end narrativePro
a written read on your year
Frequently asked questions
Is Reports & Net Worth included on the Starter plan?
Yes, mostly. The cash-flow diagram, the income and spending breakdowns, and the Net Worth Trend are all included on Starter. Connecting a mortgage servicer for a live balance, the CPA tax-package export, and the AI year-end narrative are Pro features.
Where does the Net Worth Trend get its numbers?
From your own portfolio. Estimated value comes from the property values you've recorded, or an automated market estimate where you haven't entered one, and the mortgage balance is computed from each loan's amortization schedule unless you've connected a servicer for the live reported balance instead.
What's excluded from the operating cash-flow diagram?
One-time capital expenses (a down payment, a new roof, a major renovation) are shown separately as capital invested, not folded into the operating flow. Mixing the two in would make a purchase year look like a giant operating loss.
Can I see one property at a time, or only the whole portfolio?
The cash-flow diagram, the income and spending breakdowns, and the Monthly and Annual views each filter to a single property or roll up across your whole portfolio, from a property filter on the view you're looking at. The Net Worth Trend is portfolio-wide.
Which mortgage balance does my equity use?
By default, the balance computed from your loan terms (purchase amount, rate and term), so equity works before you connect anything. Connect a servicer and you can switch that property to the balance your lender reports instead, per property, either way at any time.
Can I export these reports for my CPA?
Yes. The Annual tab exports a CPA tax package: a PDF and an Excel workbook with a summary and full transaction detail, plus an audit-trail sheet in the workbook, scoped to one property or your whole portfolio. The export is a Pro feature.
See where your own money goes.
The cash-flow diagram, breakdowns and Net Worth Trend are on every paid plan; the live mortgage balance, CPA export and AI narrative are Pro. Join the waitlist to watch your own numbers update.
Join the Waitlist14-day free trial · No credit card
For informational purposes only. Computed from the data you provide; not investment, tax, or financial advice. Consult a qualified advisor before acting on any figure.
Automated valuation model (AVM) estimate sourced from RentCast. Not an appraisal and not a formal opinion of value. For lending, sale, or tax-assessment decisions, obtain a licensed appraisal.